Free template
Creative Chart PowerPoint Template for Turning Data into a Clear Decision
This creative chart PowerPoint template shows how one set of numbers can answer a real question and end in a decision. The example scenario follows Forma Studio, a fictional 2026 project portfolio split into brand strategy at 20%, digital products at 30% and campaigns at 50%, all marked as illustrative data. The presentation shows the same mix as a horizontal bar chart, a donut chart with a 100% total at its center, and a table that adds an interpretation for each focus area. Between them, a line chart tracks quarterly revenue from 80 to 140 in USD thousands. The later slides shift from charts to reasoning: a three-step path runs from framing the question to choosing the chart and making the decision, then a slide of three actions leads to a closing reminder to give every chart a purpose. Heavy plum and cobalt headlines sit on warm apricot beside textured paper ribbons, arches and discs, so this slide deck of creative charts and graphs feels crafted, not corporate. Edit the PPT in PowerPoint or convert it for Google Slides, where fonts and layout may shift.
Explore Deckgist's AI presentation maker to turn a spreadsheet summary or quarterly report into a structured, editable presentation.
Create a presentation with AI
Enter a topic or upload reference files, then choose a theme to create a new presentation.
Create with a theme
Enter a topic or upload reference files, then choose a theme to create a new presentation.
Supports documents, PDFs, PPTs, and text files
Generate an editable presentation
AI organizes your content and completes the layout
No topic or upload needed
No topic or upload needed
What’s included
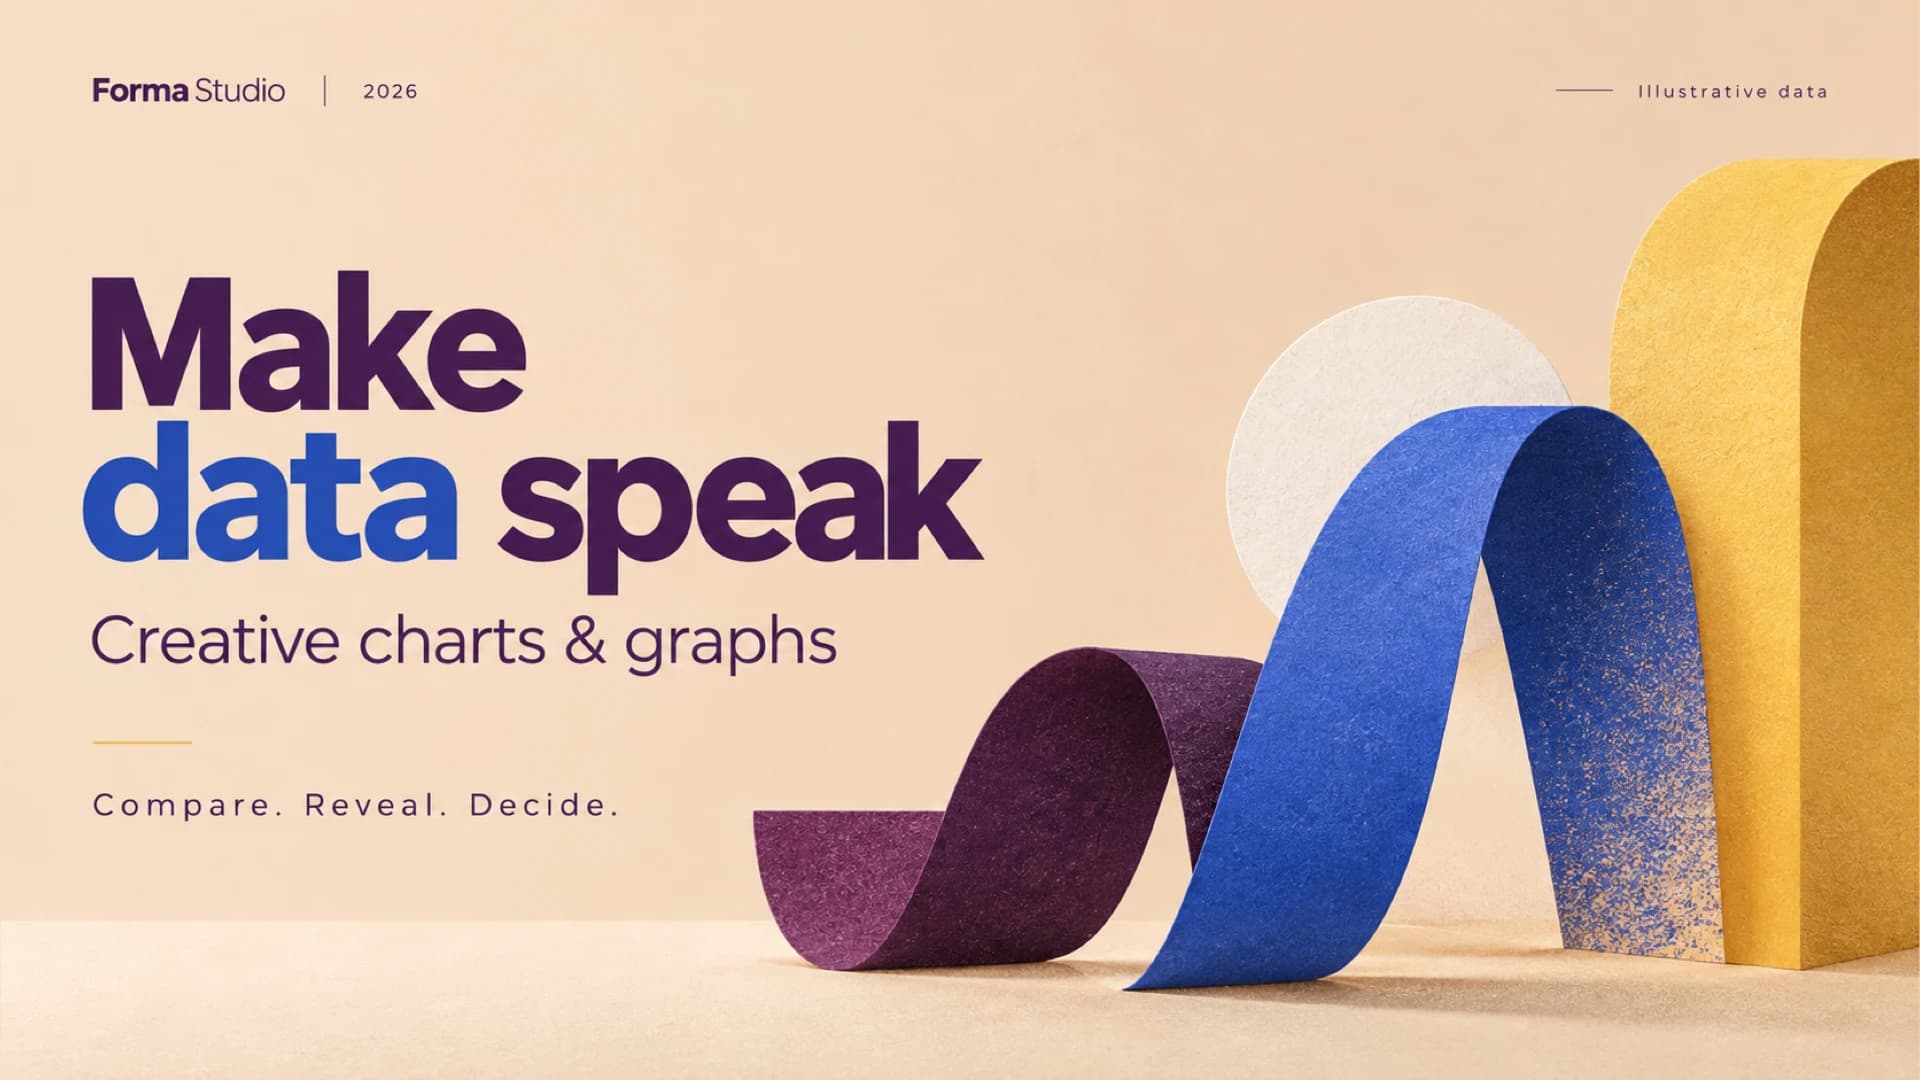
Make data speak cover
Cover slide for the Forma Studio 2026 example, introducing creative charts and graphs with the line Compare. Reveal. Decide. and an illustrative data label.
Show full textCollapse
A clear view of the mix
Illustrative horizontal bar chart of a project portfolio, showing brand strategy at 20%, digital products at 30% and campaigns at 50%.
Show full textCollapse
Track the direction
Illustrative line chart of quarterly revenue in USD thousands, rising from 80 in Q1 to 140 in Q4.
Show full textCollapse
Show the whole
Illustrative donut chart of project portfolio share with a 100% total at the center and a legend for all three focus areas.
Show full textCollapse
Compare with purpose
Illustrative table listing each focus area with its share and a short interpretation.
Show full textCollapse
From question to decision
Three-step path from framing the question to choosing the chart and making the decision, with an example question about the portfolio.
Show full textCollapse
Turn the pattern into action
Example portfolio planning slide with three numbered actions drawn from the chart pattern.
Show full textCollapse
Give every chart a purpose
Closing slide with the line One question. One clear visual. One next step.
Show full textCollapse
Best for
- Show how a project portfolio splits across three focus areas with a bar chart
- Report quarterly revenue direction with a labeled line chart
- Present each focus area's share of the whole in a donut chart
- Compare focus areas in a table with share and interpretation columns
- Walk a team from a data question to a chart choice and a decision
- Close a data review with three follow-up actions
Who this template is for
- Marketing managers
- Agency and studio leads
- Business analysts
- Project portfolio managers
- Report writers
- Creative strategists
Features of this template+
- Horizontal bar chart with percentage labels and a one-line takeaway under the chart
- Line chart with labeled Q1 to Q4 data points and dotted gridlines
- Donut chart with a center total, callouts and a matching color-coded legend
- Comparison table with Focus, Share and Interpretation columns
- Three-step question-to-decision path and a three-action planning slide with numbered icons
- Textured paper ribbons, arches and discs in plum, cobalt, yellow and cream on apricot, across editable 16:9 PowerPoint slides that can be converted for Google Slides