Free template
Business Slides Presentation Template with Graphs for Revenue Reporting
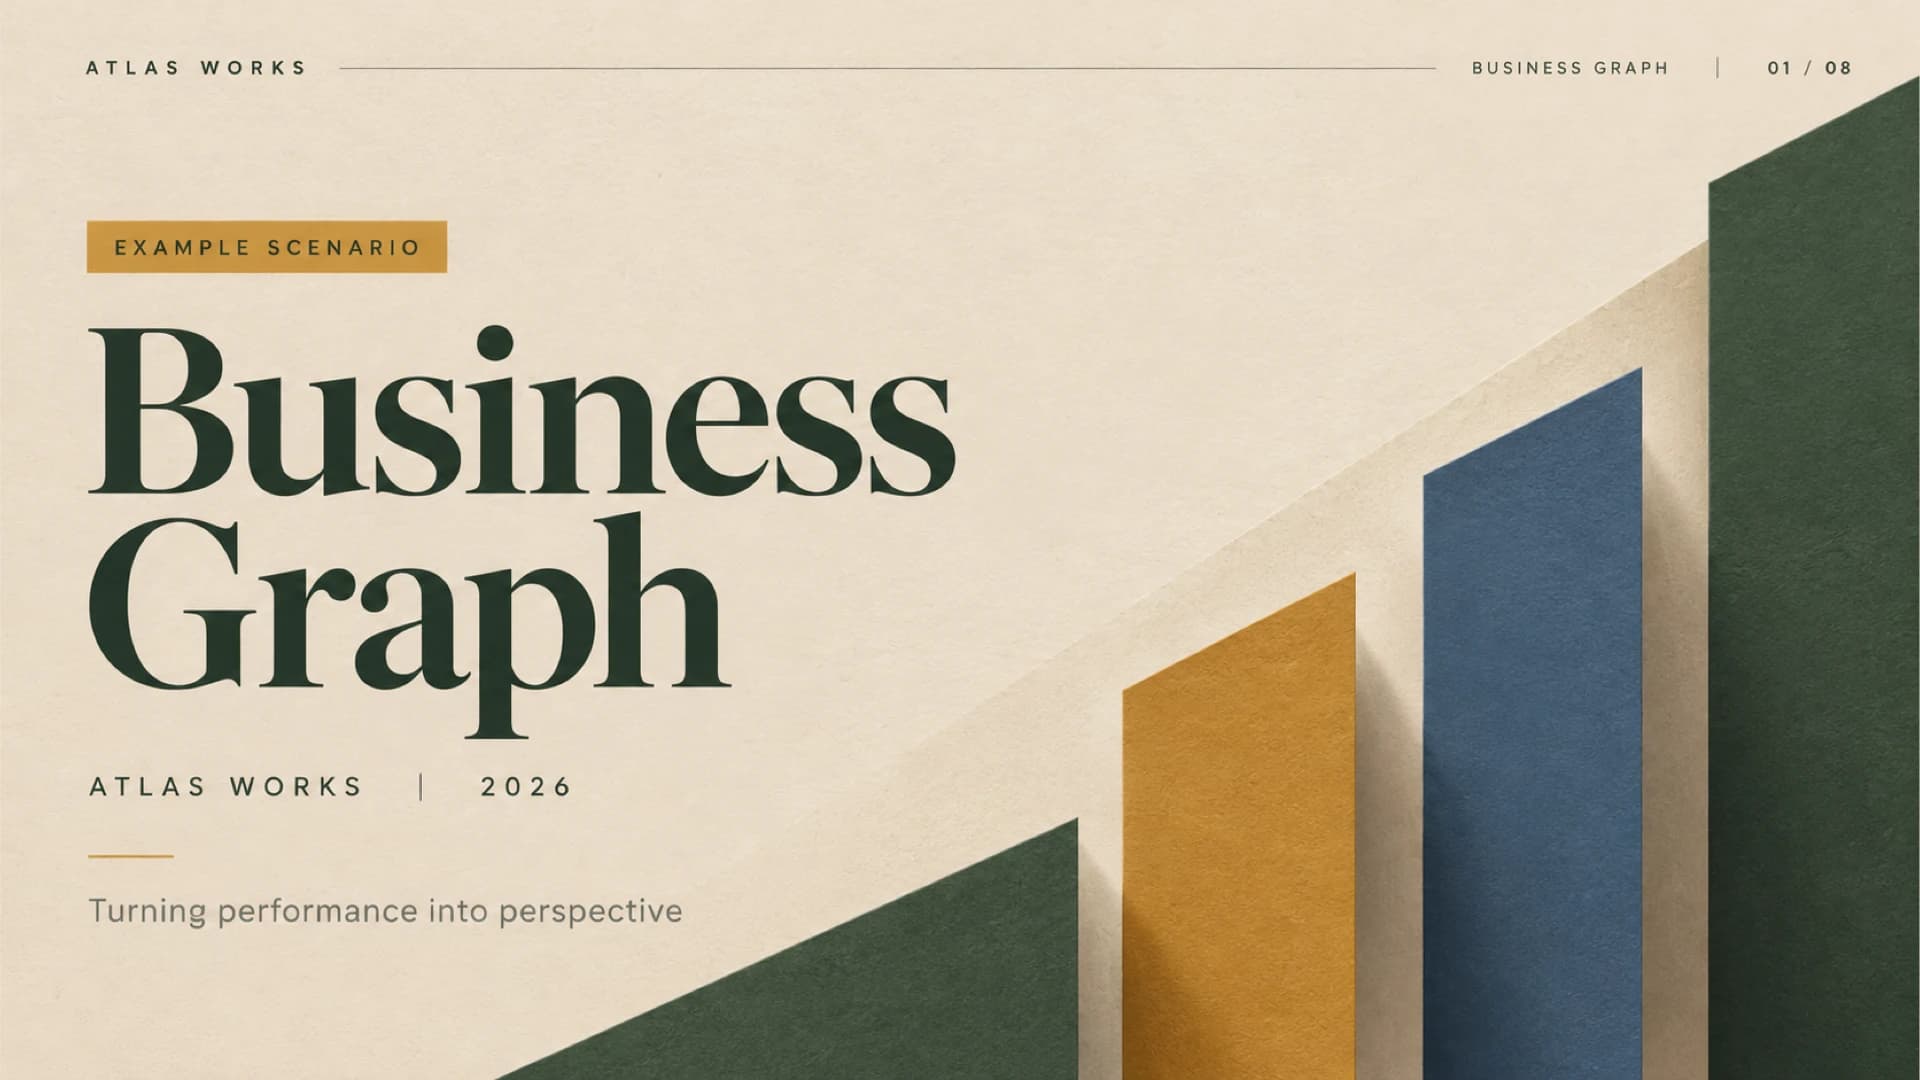
This business slides presentation helps you explain revenue with graphs rather than dense tables. In eight slides, the example company Atlas Works opens with a cover of rising paper-cut bars, then shows a quarterly bar chart climbing from 120 to 300 in USD thousands. The same four quarters return as a line chart that shows the trend. A donut chart then splits revenue into 60% product and 40% service, and a channel table compares direct and partner sales against a highlighted total. The last slides turn from reporting to reasoning. One page matches the question to the graph: bar charts compare categories, line charts show change and donut charts show composition. The next sets out three numbered steps for validating inputs, choosing the chart and highlighting the decision, before a centered close on priorities for the next quarter. Warm paper texture, olive green and mustard accents and oversized serif headlines give the PPT deck a calm editorial look, and figures are marked as illustrative. Download it as a PowerPoint file or convert it for Google Slides.
Have revenue data in a spreadsheet or a PDF report? Try Deckgist's AI presentation maker to turn it into a structured, editable presentation with its own charts and storyline.
Create a presentation with AI
Enter a topic or upload reference files, then choose a theme to create a new presentation.
Create with a theme
Enter a topic or upload reference files, then choose a theme to create a new presentation.
Supports documents, PDFs, PPTs, and text files
Generate an editable presentation
AI organizes your content and completes the layout
No topic or upload needed
No topic or upload needed
What’s included
Business graph cover
Cover slide titled Business Graph for the example company Atlas Works, 2026, with the line Turning performance into perspective and rising paper-cut bars.
Show full textCollapse
Quarterly revenue bar chart
Bar chart showing revenue growing each quarter from Q1 to Q4 in USD thousands. Data is illustrative.
Show full textCollapse
Revenue growth line chart
Line chart presenting a steady growth trajectory across four quarters, using the same revenue values in USD thousands. Data is illustrative.
Show full textCollapse
Product and service revenue donut chart
Donut chart showing product as the larger share of total revenue at 60%, with service at 40%. Data is illustrative.
- • Product 60%
- • Service 40%
Revenue by channel table
Table showing that direct sales lead the channel mix, with revenue in USD thousands for direct and partner channels and a highlighted total. Data is illustrative.
Show full textCollapse
Choose the graph for the question
Three-row guide that pairs common business questions with the chart type that answers them. Example scenario.
Show full textCollapse
Make every graph decision-ready
Three numbered steps for preparing a graph that supports a decision: validate inputs, choose the chart and highlight the decision. Example scenario.
Show full textCollapse
Turn insight into action
Centered closing slide inviting the audience to discuss priorities for the next quarter. Example scenario.
- • Discuss priorities for the next quarter
Best for
- Present quarterly revenue growth with a labeled bar chart
- Show a four-quarter revenue trend with a line graph
- Explain the split between product and service revenue
- Compare direct and partner sales channels in a totaled table
- Teach a team which chart type fits which business question
- Close a revenue update with priorities for the next quarter
Who this template is for
- Business analysts
- Finance and revenue teams
- Sales operations managers
- Small business owners reporting results
- Department heads presenting performance updates
Features of this template+
- Four-quarter revenue shown twice, as a labeled bar chart and as a line graph
- Donut chart with center label and callouts for a 60/40 product and service split
- Channel table with a mustard highlighted total row
- Chart selection page matching three business questions to bar, line and donut charts
- Warm paper texture with olive green, mustard and slate blue accents and large serif headlines
- Editable PowerPoint slides and a PPT deck that can be converted for Google Slides