Free template
Food Fortification Production and Quality Presentation Template
Use this food fortification PPT template to explain how program choices connect with production controls and quality evidence. The eight-slide lesson introduces a four-stage pathway from food-vehicle selection through premix preparation, blending and packing to quality verification. A food-plus-micronutrients diagram clarifies the concept, while a flour, oil and salt table compares consumption and production questions. Technical, production and quality responsibilities lead into a four-stage evidence checklist covering inputs through distribution. A grouped bar chart compares reporting sites with planned sites in a fictional learning program; it illustrates delivery monitoring rather than nutrition outcomes. The closing workshop recap links vehicle choice, assigned owners and evidence. Ivory backgrounds, forest-green and ochre type, grain imagery and curved photo crops give this food technology presentation a consistent teaching style. Download the English PowerPoint deck or use the Google Slides conversion entry.
To develop a separate nutrition-program lesson, try DeckGist's AI presentation generator with a course outline or program brief to create a structured, editable presentation.
Create a presentation with AI
Enter a topic or upload reference files, then choose a theme to create a new presentation.
Create with a theme
Enter a topic or upload reference files, then choose a theme to create a new presentation.
Supports documents, PDFs, PPTs, and text files
Generate an editable presentation
AI organizes your content and completes the layout
No topic or upload needed
No topic or upload needed
What’s included
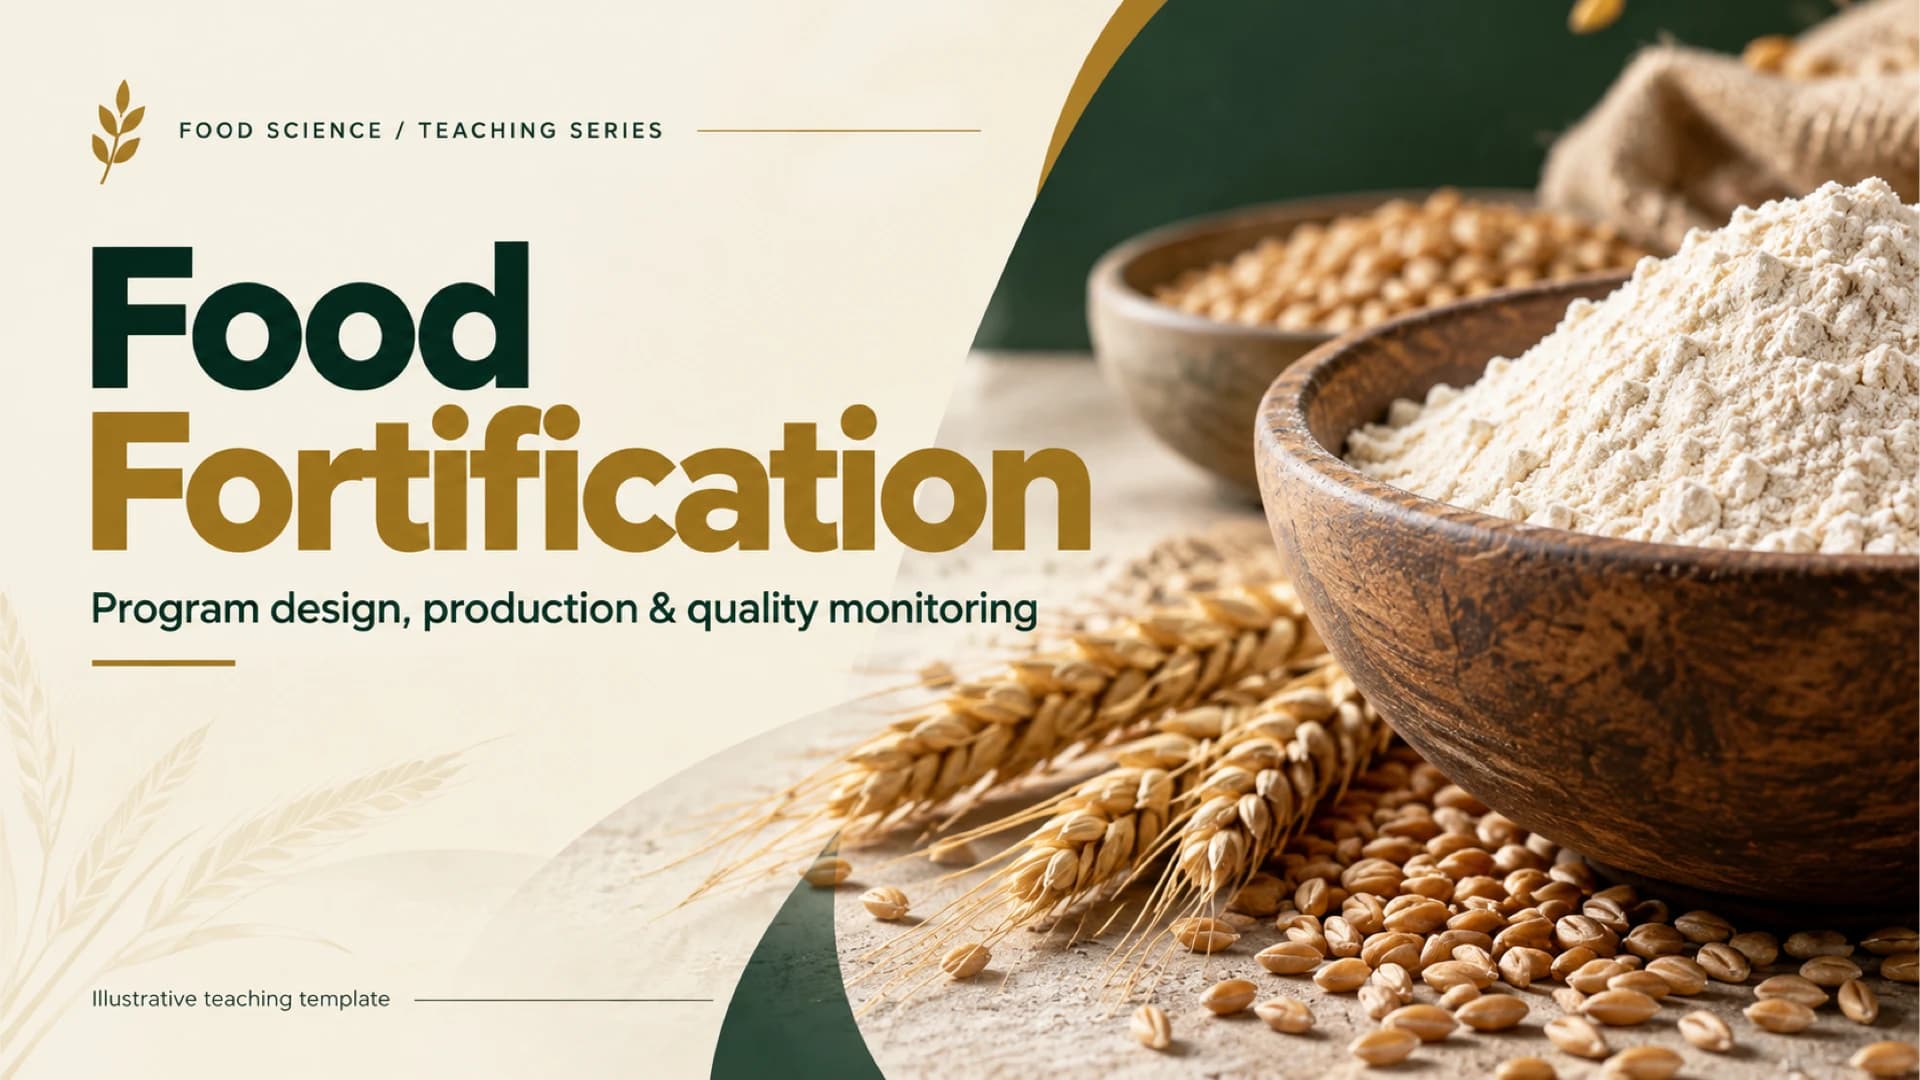
Food fortification: program design, production and quality
An illustrative teaching cover introduces food fortification through program design, production and quality monitoring.
From food vehicle to verified product
A four-stage teaching pathway moves from vehicle selection and premix preparation to blending, packing and quality checks, followed by illustrative owner and record examples.
Show full textCollapse
What fortification adds
A visual teaching equation combines a food vehicle with micronutrients to show a fortified food, with population needs and consumption informing program choices.
Show full textCollapse
Choose a food vehicle
An example planning table compares flour, oil and salt through consumption and production questions.
Show full textCollapse
Specify before production
An illustrative responsibility sequence assigns nutrient and product specifications to the technical lead, dosing and mixing documentation to production, and sampling and release checks to quality.
Show full textCollapse
Quality checks across the chain
An illustrative checklist links inputs, production, release and distribution to evidence records and responsible roles.
Show full textCollapse
Monitor delivery before claiming impact
A fictional learning-program chart compares 12, 16 and 18 reporting sites with 20 planned sites in each of three months. These are operational reporting counts, not nutrition outcomes.
Show full textCollapse
Plan, check, learn
An example workshop recap connects vehicle choice, production mapping, evidence ownership and the distinction between delivery indicators and health outcomes.
Show full textCollapse
Best for
- Explain food fortification through a production pathway
- Compare flour, oil and salt as potential food vehicles
- Discuss technical, production and quality responsibilities
- Present quality evidence from inputs through distribution
- Practice separating program delivery indicators from health outcomes
Who this template is for
- Food science lecturers
- Food technology instructors
- Public nutrition educators
- Food science students
- Fortification program training teams
Features of this template+
- Four-stage production pathway with a three-row illustrative check, owner and record table
- Food vehicle plus micronutrients diagram showing the fortified-food concept
- Flour, oil and salt comparison table organized by consumption and production questions
- Role-based responsibility sequence and four-stage quality evidence checklist
- Grouped bar chart contrasting reporting and planned sites, explicitly labeled as fictional operational data
- Ivory backgrounds, forest-green and ochre headings, curved crops and grain imagery