Free template
Food Spoilage Mechanisms Lesson Presentation Template
Use this food spoilage PPT template to teach students how to connect quality observations with plausible causes. The eight-slide lesson begins with a four-pathway comparison table, then examines mold on bread, browning in a cut apple, oxidation in nuts and moisture loss in leafy greens. A three-stage microbial diagram, an annotated apple and a fresh-versus-wilted leaf comparison give each mechanism a distinct visual explanation. An illustrative line chart supports classroom data interpretation before a final observation, hypothesis and next-step table guides discussion. Its arbitrary teaching index is not measured shelf life or a safety threshold, and the lesson keeps quality assessment separate from food-safety conclusions. Mint paper textures, purple headings, orange accents and cut-paper food illustrations suit a food technology presentation for introductory teaching. The English PowerPoint file is downloadable, with a Google Slides conversion entry available; website translations do not translate the slides.
For a separate food-science lesson, use DeckGist's AI presentation maker to turn course notes or a laboratory teaching brief into a structured, editable presentation.
Create a presentation with AI
Enter a topic or upload reference files, then choose a theme to create a new presentation.
Create with a theme
Enter a topic or upload reference files, then choose a theme to create a new presentation.
Supports documents, PDFs, PPTs, and text files
Generate an editable presentation
AI organizes your content and completes the layout
No topic or upload needed
No topic or upload needed
What’s included
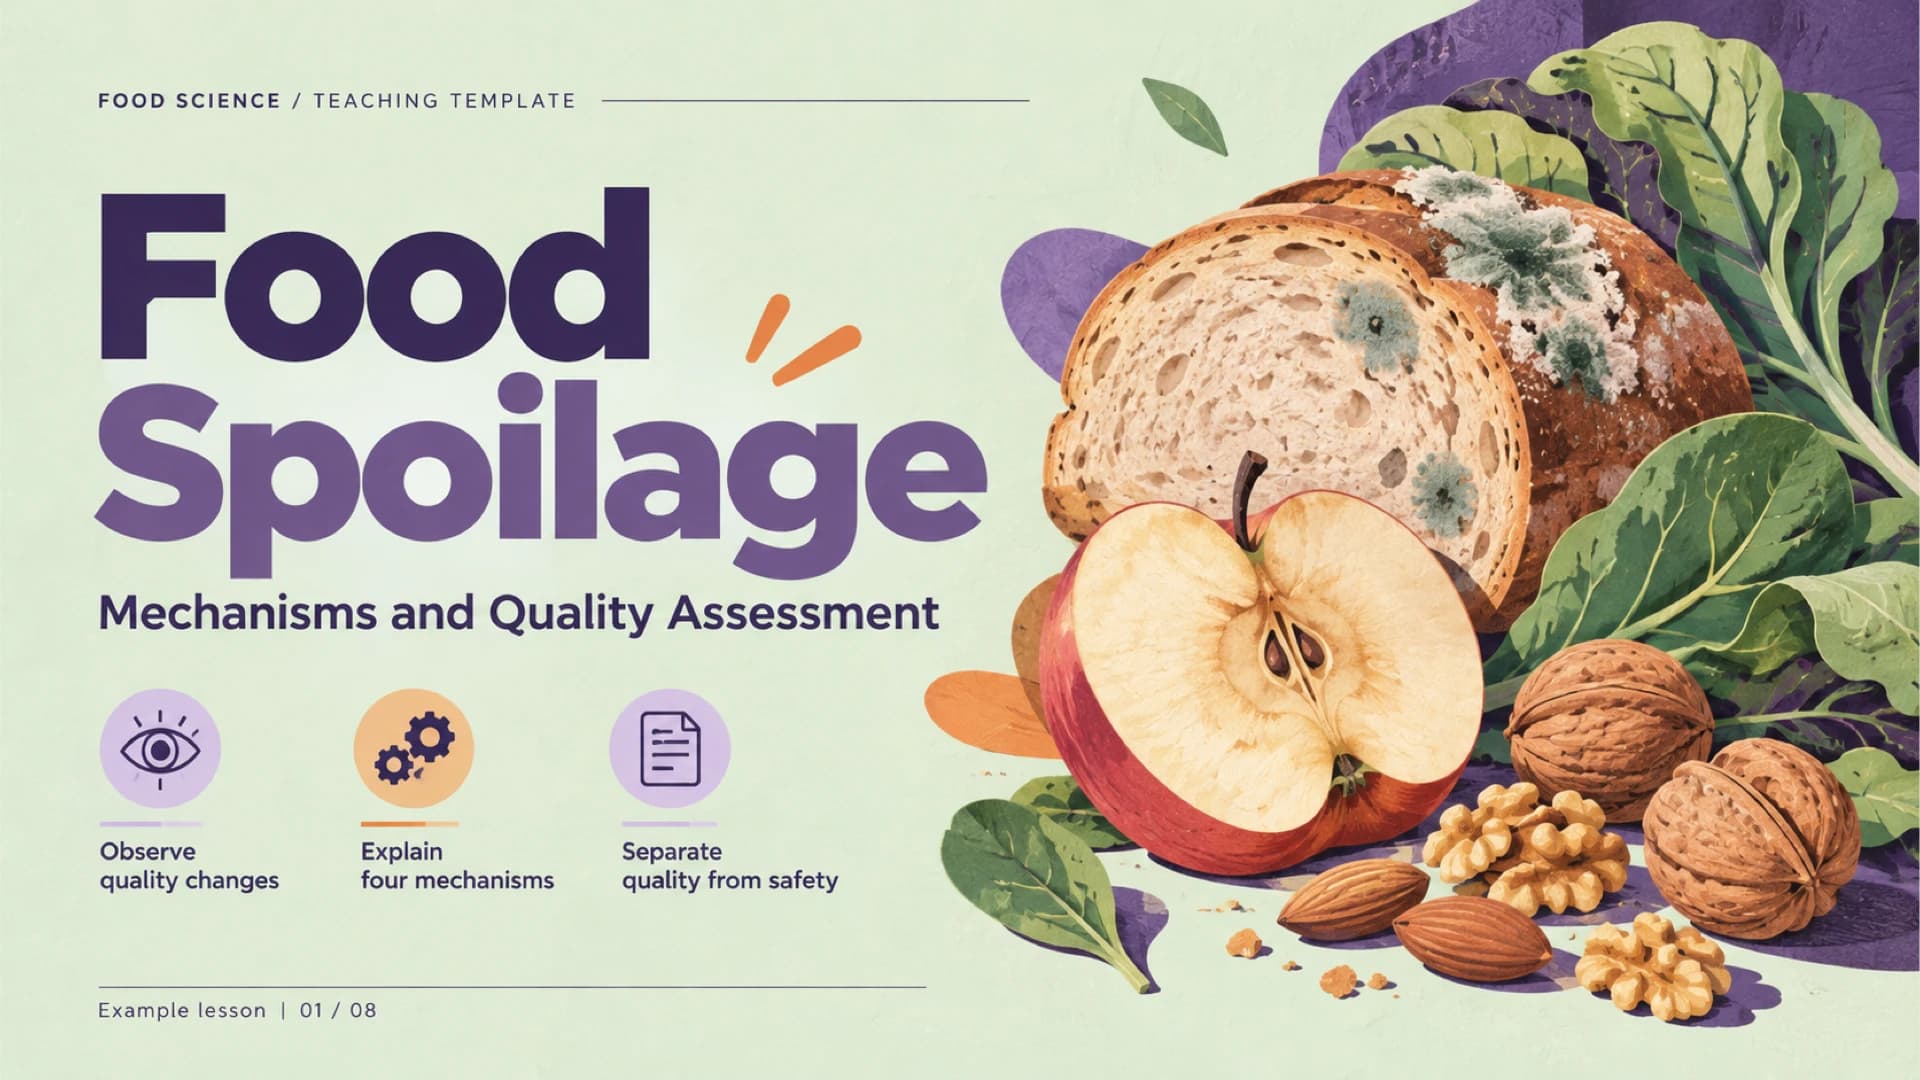
Food spoilage mechanisms and quality assessment
An example lesson introduces three aims: observe quality changes, explain four mechanisms and separate quality from safety.
Show full textCollapse
Four pathways to quality loss
An illustrative comparison table links microbial, enzymatic, chemical and physical mechanisms to bread, cut apple, nuts and leafy greens.
Show full textCollapse
Microbial change in a bread example
A three-stage illustrative sequence connects fungal growth, visible mold colonies and quality loss, with food composition and storage conditions noted.
Show full textCollapse
Enzymatic browning in a cut apple
An illustrative cut-apple case connects exposed tissue and enzyme reactions with browning and states that appearance alone cannot determine food safety.
Show full textCollapse
Oxidation and fat quality in nuts
The illustrative stored-nuts example presents rancid odor and lipid oxidation as a chemical pathway; the observation suggests a hypothesis rather than a safety verdict.
Show full textCollapse
Moisture loss and leaf texture
An illustrative fresh-to-wilted leaf comparison shows reduced firmness associated with moisture loss, with bruising and environmental exposure also noted.
Show full textCollapse
An illustrative quality-change trend
A classroom line chart plots an arbitrary change index of 0, 20, 45 and 70 across observation days 0 to 3. It is not measured shelf life or a safety threshold.
Show full textCollapse
Observe, hypothesize and verify
An example exercise pairs apple browning and leaf wilting with proposed causes and next steps, followed by questions about evidence and food-safety testing.
Show full textCollapse
Best for
- Teach the four mechanisms of food quality deterioration
- Explain microbial change using the bread-mold sequence
- Compare apple browning, nut oxidation and leaf wilting
- Practice interpreting an illustrative quality-change chart
- Lead a classroom observation and cause-analysis discussion
Who this template is for
- Food science lecturers
- Food microbiology instructors
- Food technology teaching teams
- Food science students
Features of this template+
- Four-row comparison table linking mechanism, food example, quality change and cause
- Three-stage bread-mold sequence with fungal-growth and visible-colony illustrations
- Annotated cut-apple example and fresh-versus-wilted leaf comparison
- Illustrative line chart with an explicit arbitrary teaching-index note
- Observation, hypothesis and next-step worksheet with two discussion questions
- Mint paper textures, purple type and orange accents around cut-paper food illustrations