Free template
Hypothesis Testing PPT: Statistics Lesson Template with a Worked t Test Example
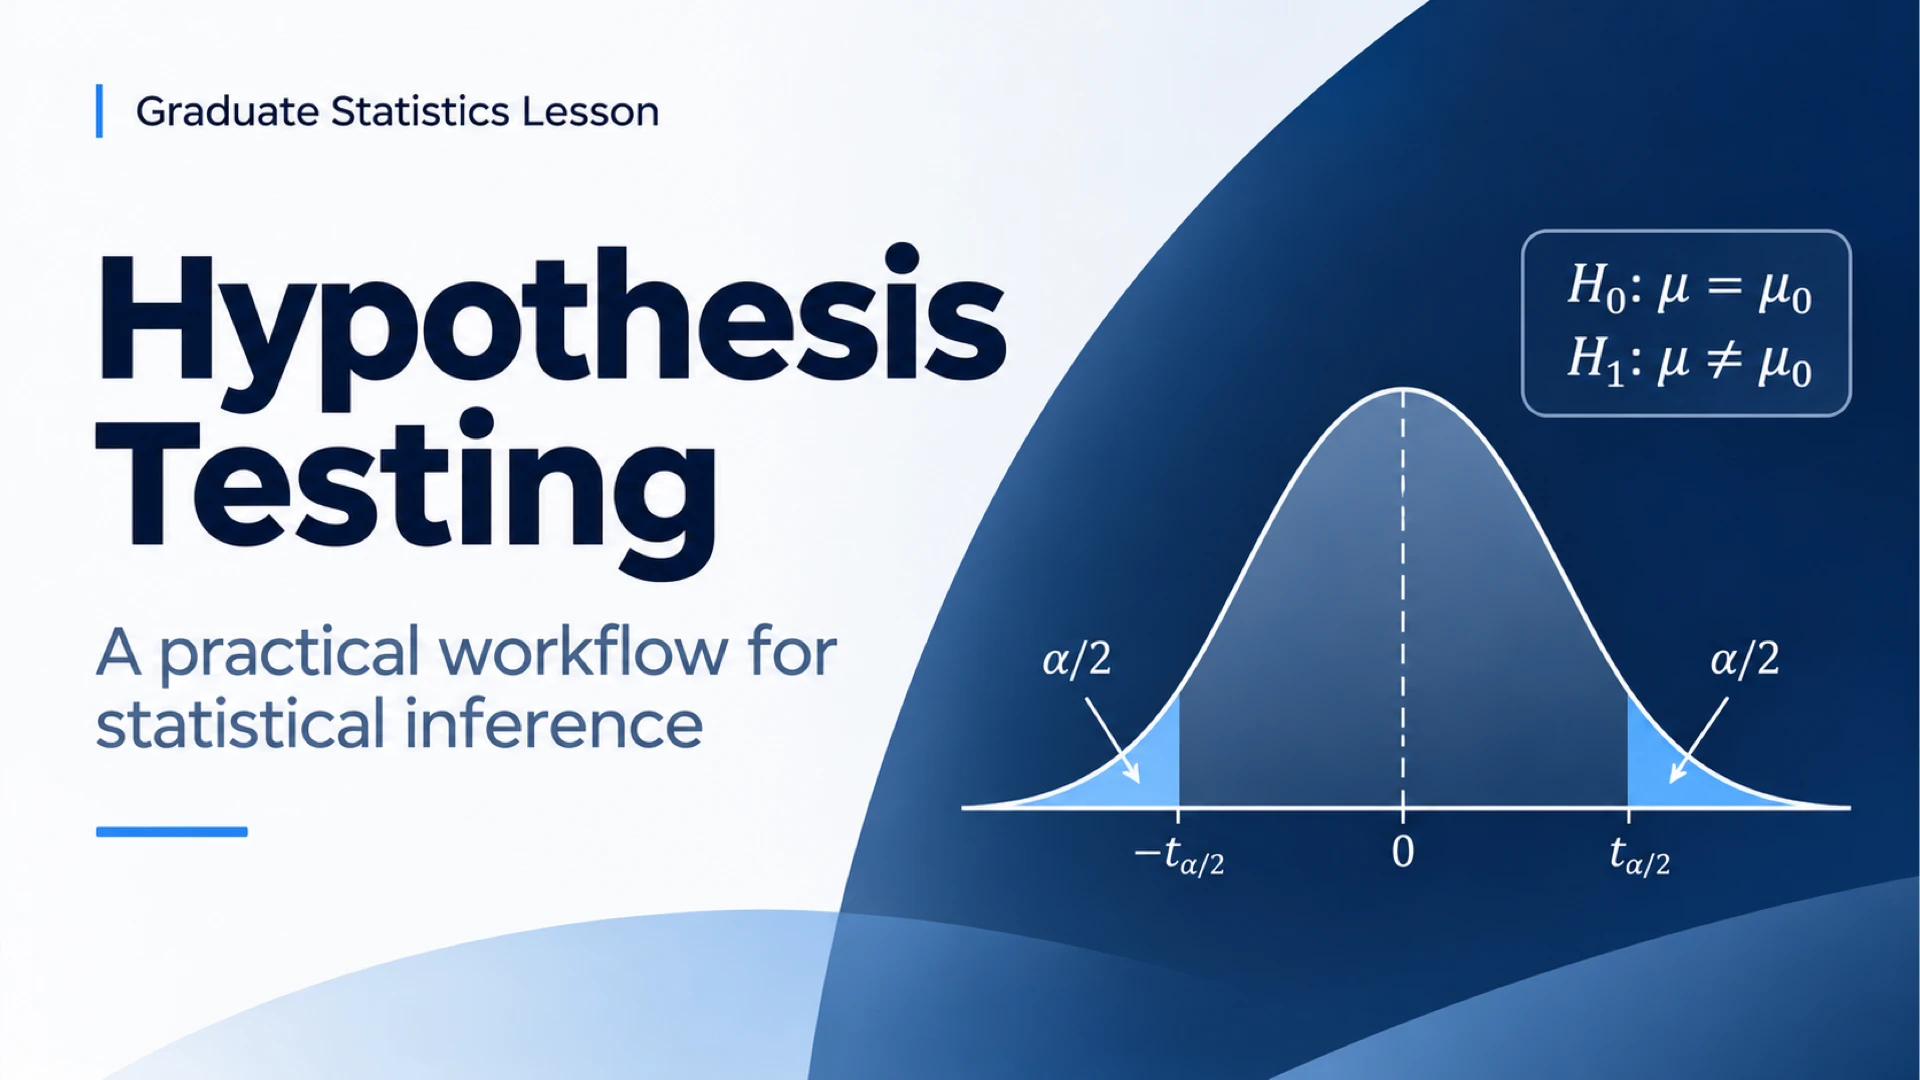
This hypothesis testing PPT is a graduate statistics lesson template that walks students through one complete inference workflow across eight slides. It opens with a cover pairing H0 and H1 notation with a two-tailed bell curve, then states the null and alternative hypotheses for a fictional bottling process claiming a 500 mL mean fill. Later slides set a 0.05 significance level with Type I and II error cards, choose a one-sample t test through a four-step flow of outcome, design, assumptions and test, and calculate t = 2.00 with 24 degrees of freedom from illustrative data. The lesson then reads a two-sided p value of about 0.057 against alpha, concludes with fail to reject H0, and closes with an interpretation exercise and a report-and-recap table with a sample reporting sentence. Visually, the editable PowerPoint presentation uses a navy and white palette, bold headings, serif math notation, rounded answer panels and a bottling-line photo crop, so instructors can swap in their own scenario. The slides can also be converted for use in Google Slides. All figures are illustrative.
Planning a different course topic? Explore Deckgist's AI presentation maker to turn lecture notes, course handouts, and PDFs into structured, editable presentations.
Create a presentation with AI
Enter a topic or upload reference files, then choose a theme to create a new presentation.
Create with a theme
Enter a topic or upload reference files, then choose a theme to create a new presentation.
Supports documents, PDFs, PPTs, and text files
Generate an editable presentation
AI organizes your content and completes the layout
No topic or upload needed
No topic or upload needed
What’s included
Hypothesis testing lesson cover
Cover slide for a graduate statistics lesson titled Hypothesis Testing, with the subtitle A practical workflow for statistical inference.
Show full textCollapse
State the hypotheses
Defines H0 as mean equals 500 mL and H1 as mean not equal to 500 mL for a fictional bottling process, framed as a two-sided test.
Show full textCollapse
Significance and errors
Sets the significance level alpha at 0.05 and compares Type I and Type II errors in the bottling context.
Choose a test
Walks through four steps from outcome type, design and assumptions to choosing a one-sample t test for the bottling example.
Show full textCollapse
Quantify the evidence
Lists illustrative data of n 25, sample mean 504 mL and sample SD 10 mL, then calculates t = 2.00 with df = 24.
Make a decision
Compares a two-sided p value of about 0.057 with alpha 0.05 and concludes fail to reject H0, noting that lack of significance does not prove H0.
Show full textCollapse
Practice the interpretation
Gives an interpretation exercise with an answer framework covering evidence, decision and limitation, plus a Type I error description in context.
Show full textCollapse
Report and recap
Summarizes hypotheses, test, statistic, degrees of freedom, p value, decision and context in a table with an example reporting sentence.
Show full textCollapse
Best for
- Teaching the step-by-step workflow of a hypothesis test in a graduate statistics class
- Explaining Type I and Type II errors with a concrete process-control example
- Showing students how to choose a test from outcome type, sample design and assumptions
- Walking through a worked one-sample t test calculation and p value decision
- Running an interpretation exercise with an evidence, decision and limitation answer framework
- Modeling how to report a test result in a clear summary table and sentence
Who this template is for
- Graduate statistics instructors
- Teaching assistants running tutorials
- Research methods lecturers
- Graduate students preparing a statistics seminar
Features of this template+
- Cover slide pairing H0 and H1 notation with a two-tailed bell curve and shaded alpha-over-2 tails
- Type I and Type II error comparison cards tied to a fictional bottling example
- Four-step test-selection flow from outcome type and design to a one-sample t test
- Worked calculation panel with the t formula, sample inputs and t and df readouts
- Navy and white design with serif math notation, rounded answer panels and bottling-line photography
- Editable PowerPoint slides that can be converted for use in Google Slides