Free template
Lesson Plan Presentation Template for a Timed Grade 7 Science Lesson
This lesson plan PPT helps a teacher present one lesson to a department team, mentor or observer before teaching it. The eight-slide lesson plan presentation is built around an example Grade 7 science lesson, Exploring ecosystems, timed at 45 minutes. After the cover, a lesson-at-a-glance slide maps five phases, Engage, Explore, Explain, Apply and Assess, onto minute ranges from 0 to 45. The next slides explain why the lesson matters, profile 28 learners with an editable bar chart (21 can name a habitat, 12 can explain a food chain), and pair two learning goals with matching success criteria. The second half covers a materials table with quantities and learning purposes, an exit-ticket prompt with a sample response and a four-step evidence path, then a donut chart of 24 of 28 learners and a reteaching next step. Every data slide is marked as illustrative example data. Sage green, warm gold and cream paper textures frame pond photography, torn edges and botanical line art. The editable slides work as a PowerPoint template and open in Google Slides through the conversion option.
Explore Deckgist's AI presentation maker to turn a unit outline or curriculum PDF into a structured, editable lesson presentation.
Create a presentation with AI
Enter a topic or upload reference files, then choose a theme to create a new presentation.
Create with a theme
Enter a topic or upload reference files, then choose a theme to create a new presentation.
Supports documents, PDFs, PPTs, and text files
Generate an editable presentation
AI organizes your content and completes the layout
No topic or upload needed
No topic or upload needed
What’s included
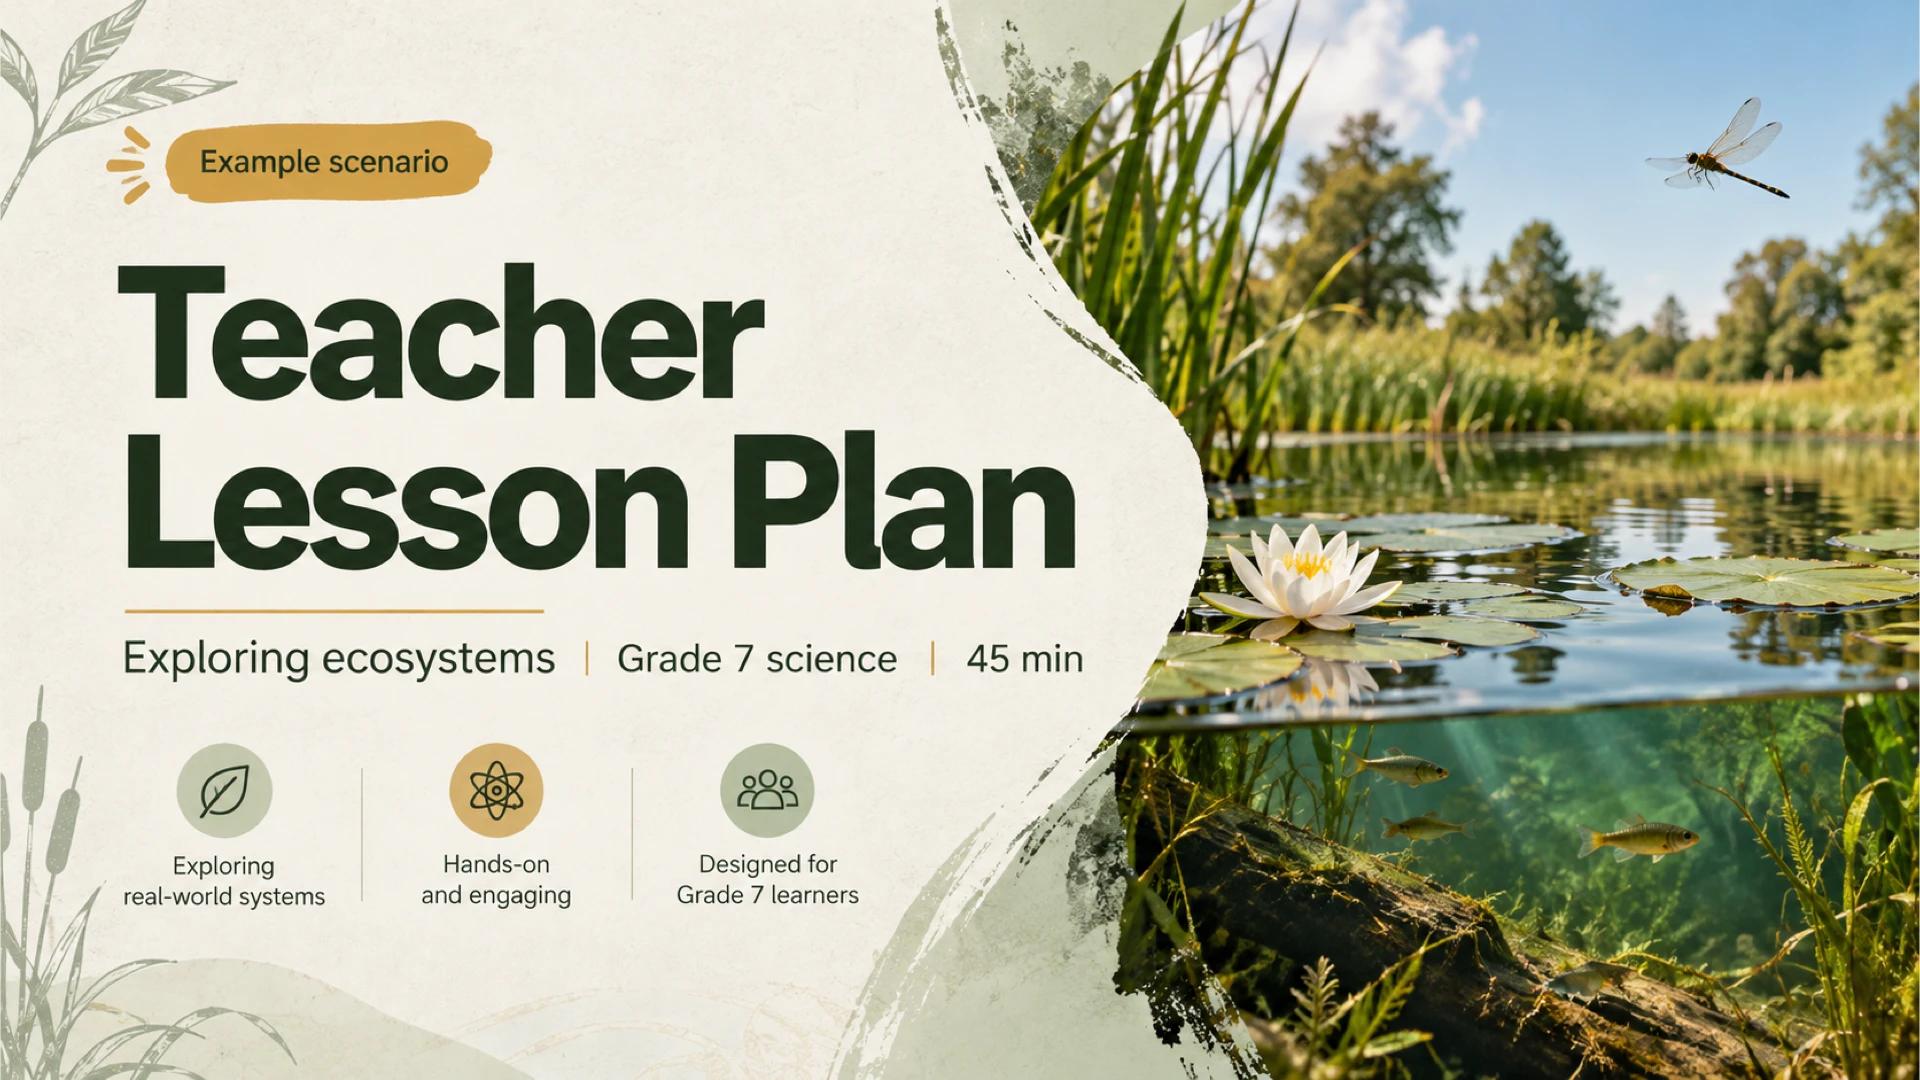
Teacher lesson plan cover
Cover slide for an example Grade 7 science lesson, Exploring ecosystems, lasting 45 minutes, with three icon highlights beside a pond photograph.
Show full textCollapse
Lesson at a glance
A five-phase timeline for a 45-minute lesson: Engage, Explore, Explain, Apply and Assess, each with a minute range and a short activity.
Show full textCollapse
Why this lesson, why now?
The lesson rationale: a Grade 7 inquiry lesson that connects a familiar pond ecosystem to system thinking through three steps.
Show full textCollapse
Know the learners
An illustrative class profile of 28 learners: 21 can name a habitat and 12 can explain a food chain, plus two vocabulary support cards.
Show full textCollapse
Learning goals and success criteria
Two learning goals, each linked to a success criterion that shows how the teacher will know students have succeeded.
Show full textCollapse
Materials that make thinking visible
A materials table listing each classroom resource with its quantity and learning purpose.
Show full textCollapse
Assessment in the moment
An exit-ticket prompt and sample response, followed by a four-step evidence path from observation to feedback.
Show full textCollapse
Reflect, respond, extend
An illustrative donut chart shows 24 of 28 learners sequencing a four-part food chain, with a next step to reteach 4 learners using picture cards.
Show full textCollapse
Best for
- Presenting a single lesson plan to a department or grade-level team
- Preparing for a formal lesson observation with a mentor or principal
- Student teacher practicum lesson plan presentation
- Sharing learning goals, success criteria and timing with a co-teacher
- Reviewing exit-ticket evidence and planning a reteach group
Who this template is for
- Middle school science teachers
- Student teachers and teacher candidates
- Instructional coaches and mentors
- Department heads reviewing lesson plans
- Classroom teachers preparing for observations
Features of this template+
- Lesson-at-a-glance timeline with five numbered phases and minute ranges that total 45 minutes
- Learner profile slide with an editable bar chart and two vocabulary support cards
- Learning goals paired with success criteria using bracketed connectors and check marks
- Native materials table listing resource, quantity and learning purpose
- Exit-ticket evidence path and donut chart for reflecting on results and next steps
- Sage green and gold pond ecosystem design with photography, torn paper edges and botanical line art, editable in PowerPoint and convertible to Google Slides